
Troubleshooting PC issues often requires a thorough understanding of system performance. The Task Manager provides a vital tool for monitoring and optimizing your computer’s functionality through its Performance tab. This interface not only helps you diagnose problems when they arise but also enhances your understanding of your system’s capabilities.
What Is the Performance Tab in Task Manager?
The Performance tab of the Task Manager offers an in-depth, real-time perspective on the resource utilization of your Windows computer. It displays various graphs and metrics to help you evaluate system performance, detect potential bottlenecks, and effectively manage applications that demand substantial resources.
To access the Performance tab, right-click an empty area of the taskbar and select Task Manager, or press Ctrl + Shift + Esc simultaneously. Within the Task Manager interface, navigate to the Performance section in the left sidebar.

Utilizing the Performance Tab Effectively
The Performance tab is organized into multiple sections, which vary depending on the configuration of your PC. Below is an overview of each section and its utility in identifying system issues.
CPU

The CPU section presents real-time usage through visual graphs along with percentage data. It details information about your processor, such as its model, number of cores, threads, and clock speed. Monitoring this can reveal how long your system has been active and which processes are currently running.
If your computer exhibits sluggish behavior, especially during demanding tasks like gaming or video editing, checking the CPU tab is a wise choice. High utilization levels (90–100%) may signal a bottleneck, prompting you to explore solutions to alleviate high CPU usage.
Memory

This section reflects your system’s RAM usage, showing both total RAM and the amount currently in use or available. Key indicators include Committed memory, which represents memory being actively used, and Paged pool, indicating how much disk space Windows allocates as “virtual memory”when RAM is limited.
This section is crucial during multitasking scenarios. If memory usage nears 90–100%, you may want to identify and terminate resource-heavy applications that are causing lags, such as browsers or complex software.
Disk

This segment displays activity metrics for each storage device in your computer, highlighting variables such as active time and data transfer rates. It offers valuable insights such as capacity and the disk type, including whether it’s your System disk.
Excessive disk usage may indicate underlying issues, particularly during file transfers or loading operations. Utilize this data to pinpoint applications that excessively consume disk resources, and consider whether an upgrade to SSD storage might enhance performance.
Wi-Fi/Ethernet

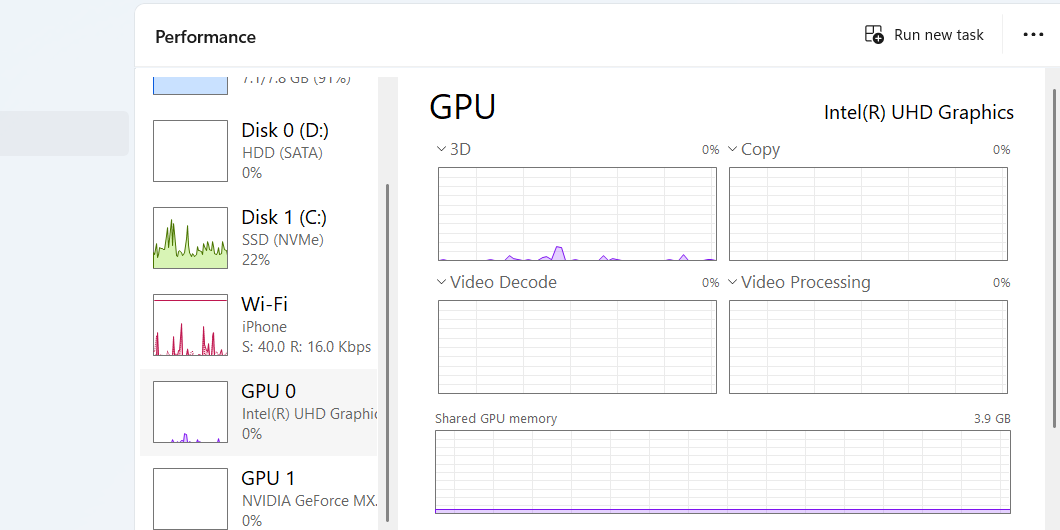
GPU
Exploring Resource Monitor (Resmon)
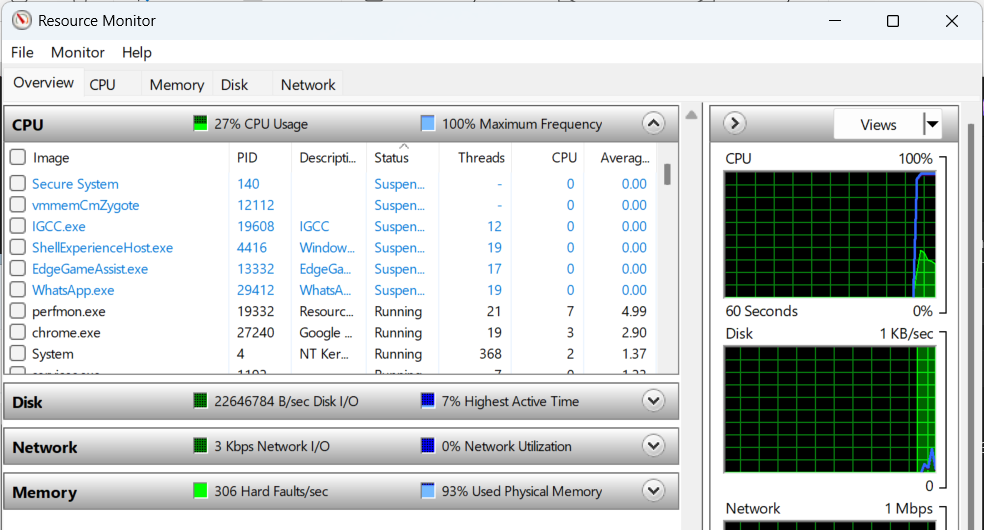
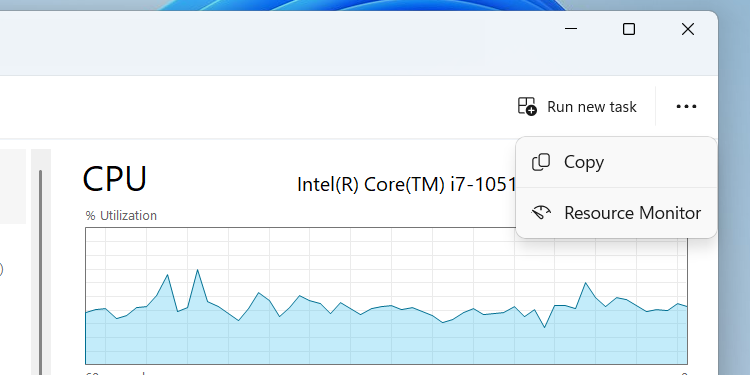
To access the Resource Monitor directly from the Performance tab, click the three-dot icon located in the top-right corner, then select Resource Monitor from the dropdown menu. Alternatively, you can open it independently by typing “resource monitor”in the Start menu.
Once launched, the Resource Monitor provides a more granular analysis suitable for identifying specific issues. With various tools at your disposal, mastering the functionality of these built-in Windows utilities can greatly enhance your systematic performance management and troubleshooting skills.
Investing time to become proficient with the Task Manager’s Performance tab is the first step toward effectively optimizing and managing your Windows system.
Related Articles:

Essential Command-Line Tools for Windows PCs: My Top 4 Picks
11:41
Windows 11 Updates: Microsoft Releases KB5068516 and KB5067040 for Setup and Recovery
11:39
Windows 11 Update Naming Simplified: IT Admins Are Frustrated by the Removal of YYYY-MM Format
11:38
Leave a Reply