
For years, I relied on Excel for straightforward calculations and creating basic tables. While I utilized common formulas and performed simple data manipulations, I never felt compelled to delve into the more intricate functionalities of Excel until my projects became increasingly complex.
The Challenge That Triggered My Exploration
The escalating costs of PC components in my region—often higher than prices in the United States due to market fluctuations and import taxes—prompted me to investigate the price disparity. I aimed to determine whether it was more economical to purchase directly from platforms like Amazon or Newegg instead of local retailers. To do this, I gathered several months of pricing data on essential PC parts, including CPUs, GPUs, and RAM. What I initially thought would be a straightforward tracking project quickly turned into a daunting task.
The data I amassed was chaotic. Each retailer’s file came in a different format, complicating any attempt to merge them. For instance, Amazon recorded dates in MM/DD/YYYY format, while Newegg used YYYYMMDD, and my local shop Shopee adhered to a DD-MM-YYYY standard.

The data inconsistencies didn’t end with the date formats. The column names were entirely different: Newegg marked prices as “retail_price, ”Amazon opted for “unit_price_usd, ”and Shopee simply labeled it “price_php.”Furthermore, price formatting varied, with some entries displaying currency symbols like “₱18, 600, ”while others were noted as plain numbers such as “320.”Even brand names were inconsistent, appearing in various formats like “gigabyte, ””GIGABYTE INC., ”or “Gigabyte Tech.”
Cleaning and consolidating this data manually was turning into an exhausting endeavor. I found myself spending countless hours copying between files, replacing inconsistent values, and meticulously removing blank rows. Additionally, converting prices from PHP to USD required constantly referencing live exchange rates on a second monitor. This labor-intensive process was tedious and fraught with potential errors, nearly driving me to abandon the project.
That’s when I decided to explore a feature that Excel aficionados frequently rave about—Power Query. While there are numerous advanced tools in Excel, I discovered that Power Query specifically addressed my issues. After watching instructional videos on YouTube, it became evident how much time I could save by utilizing Power Query Editor to tidy up the disorganized data I had gathered.
My Step-by-Step Approach to Using Power Query
In no time, I developed a straightforward procedure in Power Query Editor to clean up those messy CSV files and convert them into a coherent, organized spreadsheet.
I began by importing the data into Power Query Editor. I opened a new Excel workbook, selected Data from the ribbon, and chose From Text/CSV. After selecting my CSV file, I clicked Transform Data to enter the Power Query Editor.
The first step was to standardize the Date column. Given the two sources had timelines that were 12 hours apart, ensuring uniform date formatting was essential. This process proved remarkably straightforward. I highlighted the Date column, right-clicked, and selected Change Type > Using Locale. In the ensuing pop-up, I set the type to Date and chose English (United States) to ensure consistent formatting. Power Query adeptly identified various formats—MM/DD/YYYY, YYYY/MM/DD, DD-MM-YYYY—and standardized them to a single format with ease.

With the date format corrected, I moved on to clean the column. As most errors stemmed from my data scraping tool, I utilized the Remove Errors filter to eliminate erroneous entries. This step effectively removed null values and any remaining problematic data, ensuring a consistent date representation across all files.

Next, I addressed the chaotic brand names through the Replace Values functionality. After selecting the relevant column, I right-clicked, accessed Replace Values, and input and standardized all variants of the brand names, such as transforming “gigabyte”and “GIGABYTE INC.”into one consistent entry: “GIGABYTE.”The same approach applied to AMD, effectively streamlining the Brand column across all data sources.
-
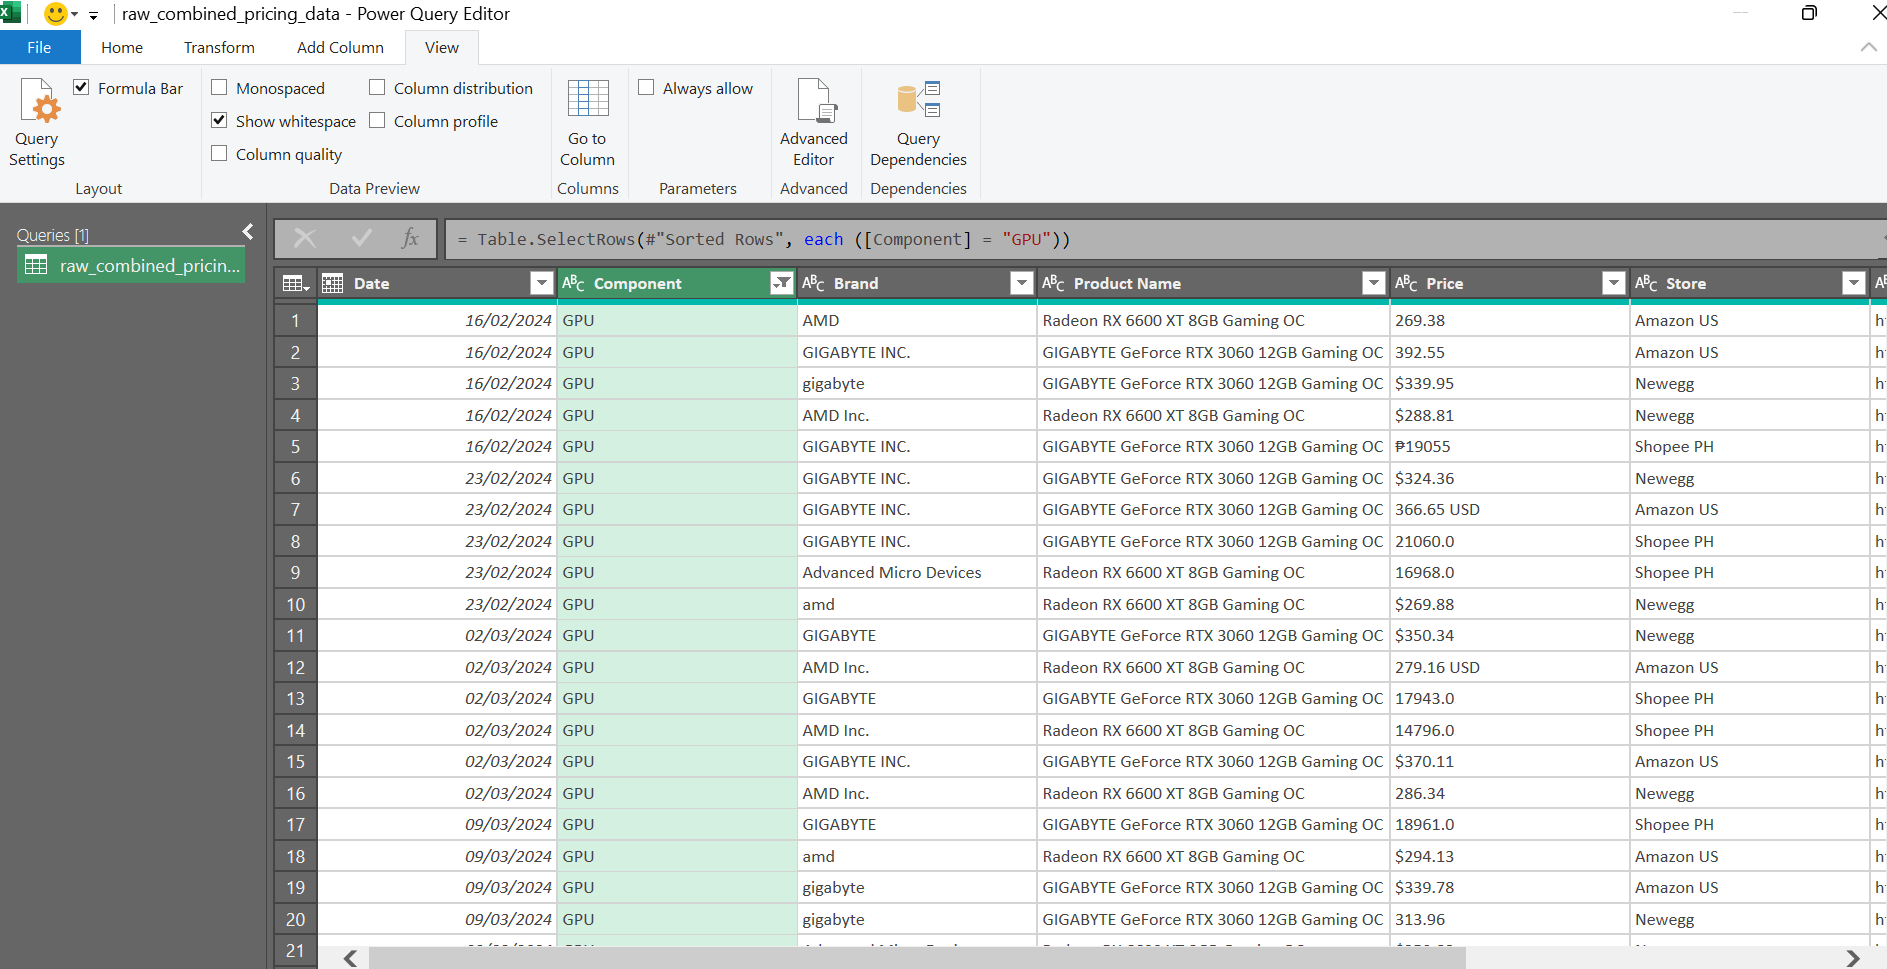
Screenshot by Jayric Maning – No attribution required -
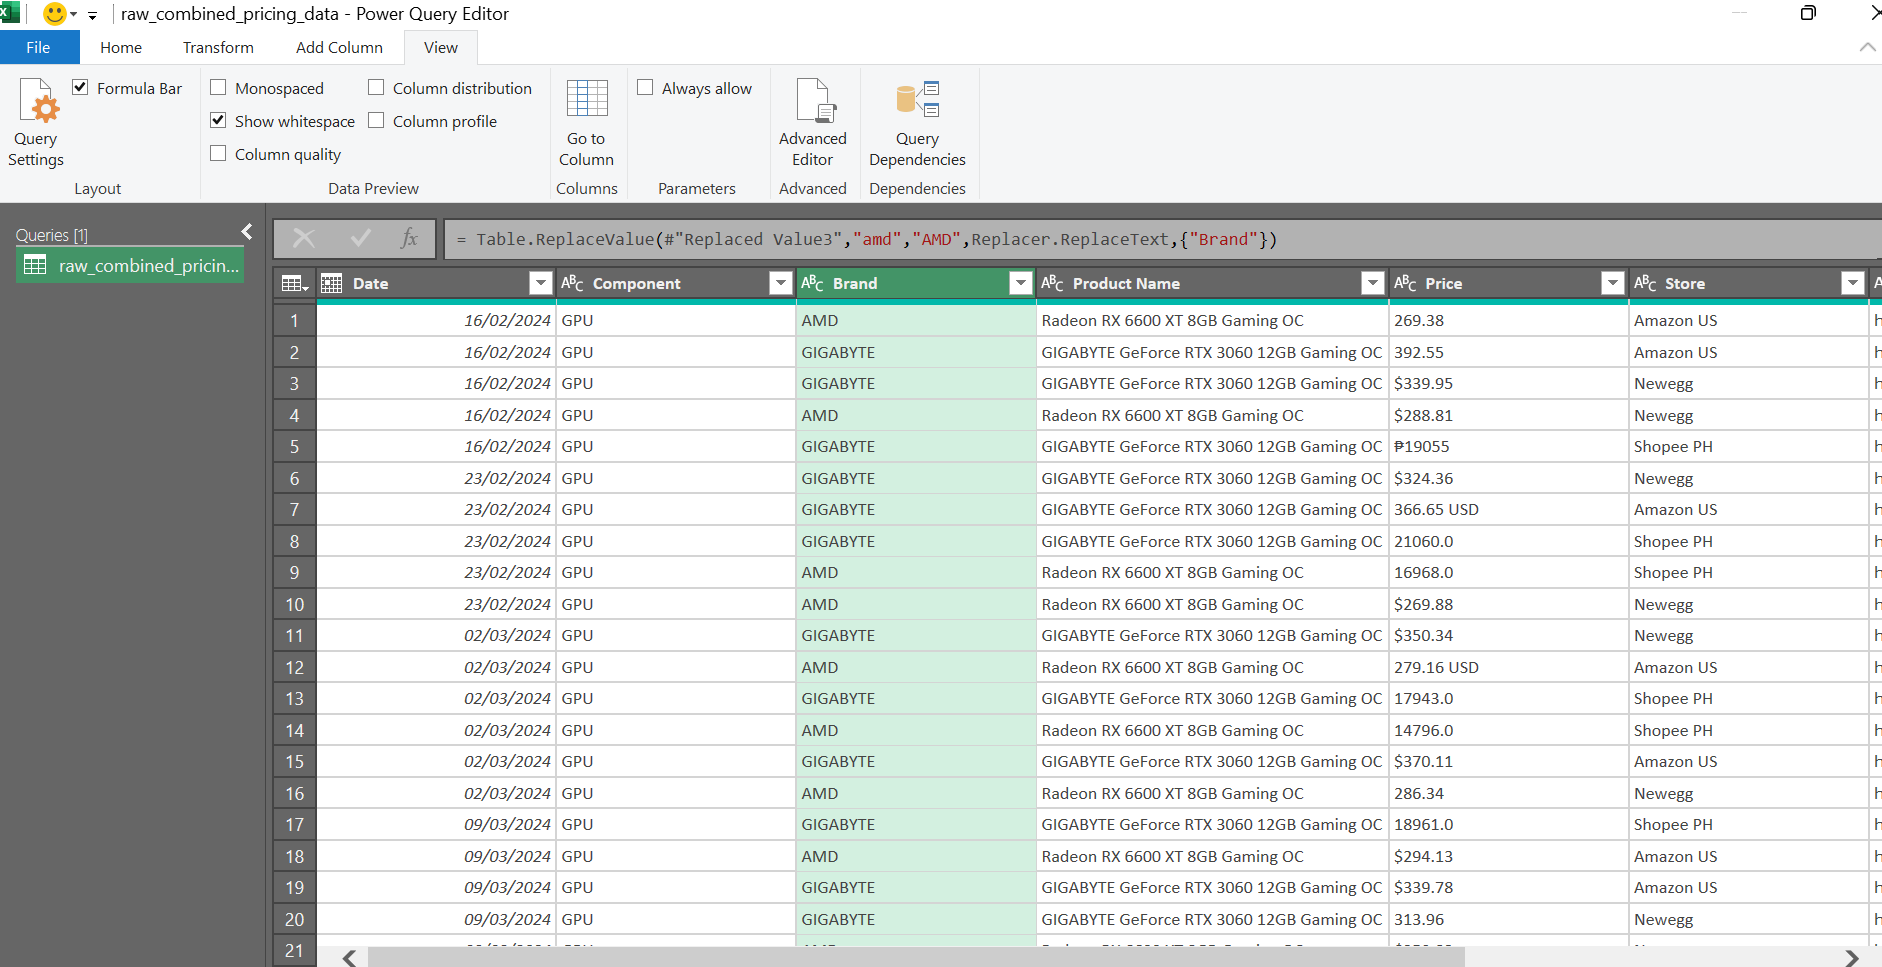
Screenshot by Jayric Maning – No attribution required
Finally, I standardized the Price column. This presented a challenge since many entries were mere numbers devoid of context regarding their currency, complicating conversion efforts. Fortunately, the Store column provided immediate context, enabling straightforward conversion of Shopee PH prices into USD.
To tackle this issue, I first used Replace Values to eliminate all currency symbols (e.g., $, ₱, USD, PHP) from the Price column. After converting these entries into decimal format by selecting Change Type > Decimal, I created a new column labeled “Price USD” using Custom Column under the Column tab. I implemented the following formula:
if [Store] = "Shopee PH"then Number. Round([Price] / 55, 2) else Number. Round([Price], 2)
By clicking Okay, I converted all prices from Shopee PH into USD for clear comparison.

The formula is crafted in the Power Query M formula language. This scripting language offers a straightforward syntax that is relatively easy to understand. One doesn’t need to master the entire language to utilize it effectively; I refer to it only as necessary to construct my formulas.

Once the data was rectified, I simply closed the Power Query Editor, clicked Keep to save all changes made to my workbook.
The Time Savings From Power Query
Initially, I hesitated to embrace Power Query, fearing it would introduce yet another complicated feature that would consume too much of my time. Contrary to my expectations, I found it much simpler. Rather than executing endless find-and-replace actions, Power Query enabled me to efficiently cleanse the data produced by my scraping tools.
What astonished me further was the fact that every adjustment I implemented was documented, allowing me to replicate the cleanup process effortlessly. This essentially functions as an automated script for data cleanup, transforming chaotic CSV files into well-organized spreadsheets—ideal for situations involving custom datasets generated via web scraping, where data quality is often inconsistent.
For those who frequently manage cumbersome data cleanup tasks, inconsistent formats, or multiple data sources, Power Query streamlines these processes into a manageable, automated workflow. Instead of spending hours each week fixing issues manually, a simple click of Refresh allows you to dive straight into analysis. It’s a powerhouse feature of Excel that I wish I had adopted much sooner. Once you experience the efficiency of an automated, easily repeatable cleanup process, there’s no turning back.


Leave a Reply